Credit Quarterly Recent News
U.S. Loan Portfolios Continue to Shrink
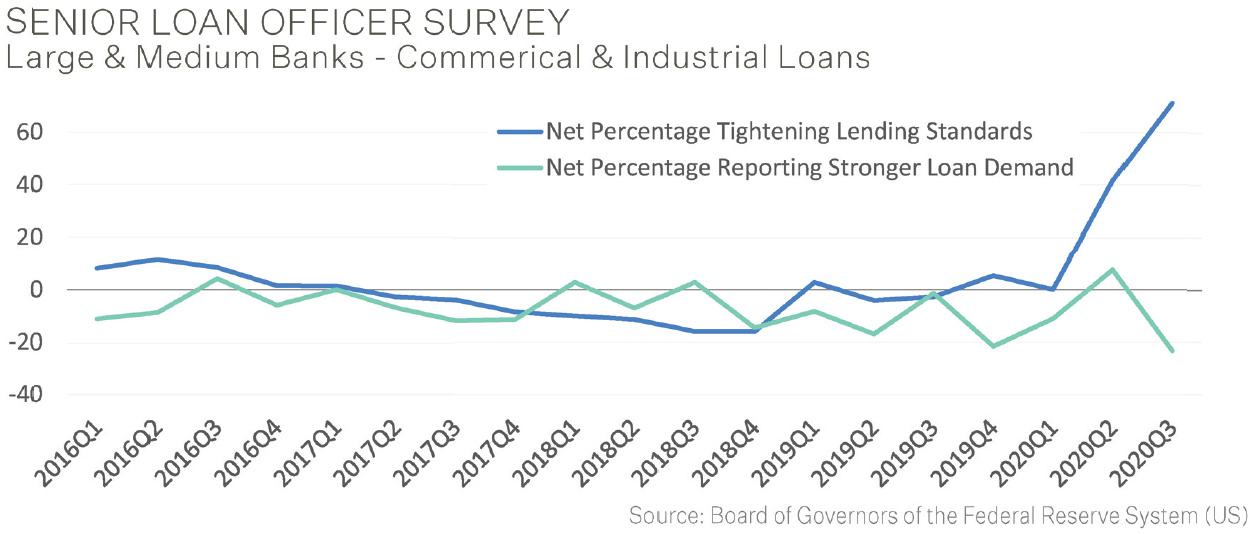
The decline in lending that began in May appears to have continued throughout the third quarter, with U.S. banks reporting that they have tightened underwriting amid weak demand for credit. “The loan growth picture appears quite challenged for the large banks,” Compass Point analyst David Rochester said in a note on November 6. For small banks, “growth remains anemic at best.” Much of the contraction in lending is explained by declines in commercial and industrial borrowing.
After a surge in March and April as businesses tapped bank lines of credit to build up cash reserves, corporations have now turned to capital markets backstopped by the Fed to meet their funding needs. As a result, in the third quarter, seasonally adjusted C&I lending at U.S. commercial banks fell by 5% from the prior quarter. According to the October Senior Loan Officer Opinion Survey, this was due to a combination of tightening lending standards and weaker loan demand (see below). Meanwhile, total seasonally adjusted deposits at commercial banks increased 1% during the third quarter. Since late February, commercial bank deposits have jumped by approximately 18%. This funding mismatch (stronger deposits & weaker loan growth) has created excess liquidity and without loan demand, banks have been buying securities to help protect margins. Banks’ securities portfolios, consisting mostly of Treasuries and government-backed mortgage bonds, increased 4.7% during the third quarter. Nevertheless, deposit growth has outstripped loan growth during the pandemic, and it remains unclear when a rebound in credit demand will materialize.

Credit Quarterly Banking Trends
3rd Quarter 2020 Highlights
FDIC-insured institutions reported third quarter 2020 net income of $51.2 billion, up $32.4 billion (173%) from second quarter 2020, yet down $6.2 billion (10.7%) compared with the prior year period. The quarterly increase in net income was attributable to a $47.5 billion (76.8 percent) decline in provision expenses between second and third quarter 2020. Lower net interest income drove the annual decline in net income. Slightly more than half (51.3 %) of all banks reported year-over-year declines in net income, and the percentage of unprofitable banks in the third quarter increased from a year ago to 4.7%. Average net interest margin (NIM) was down 68 basis points from a year ago to 2.68%, as the decline in average earning asset yields outpaced the decline in average funding costs. This is the lowest NIM and the largest year-over-year basis point decline reported in the QBP.
Quarterly provisions for credit losses totaled $14.4 billion, down nearly 77 percent from second quarter 2020, but up 3.5 percent from third quarter 2019. Just over half of banks (52.9 percent) reported higher provisions for credit losses than a year ago. Noncurrent balances for total loans and leases increased $9.3 billion (7.90%) during the third quarter compared to the prior quarter. The net charge-off rate declined by 5 basis points from a year ago to 0.46 percent. The annual decrease in total net charge-offs was attributable to a $1.3 billion (15.9 percent) decline in credit card net charge-offs.
Total assets rose by $81.6 million (0.4%) from the previous quarter. Cash and balances due from depository institutions decreased by $54.2 billion (1.9%). Securities holdings rose by $275.3 billion (6.1%). Total equity capital increased by $36.3 billion from the previous quarter. Quarterly net income in the second quarter totaled $51.2 billion, exceeding declared dividends of $15.8 billion, contributing $35.4 billion to retained earnings. The number of institutions on the FDIC’s “Problem List” increased from 52 to 56 in the third quarter. During the quarter, one new charter was added, 33 institutions were absorbed by mergers, and no banks failed.
Source: FDIC: Quarterly Banking Profile
The PMA Report
The PMA Credit Research Process
The PMA Process includes four steps which begin with gathering data and analyzing a bank’s credit quality and continues with ongoing risk management throughout the life of a deposit. The process helps public funds investors avoid repayment, reinvestment and reputation risk that may be associated with a bank failure.
Step 4: Ongoing Risk Management
Risk management procedures include deposit restrictions and collateral requirements. PMA’s Credit Committee, which includes members of PMA’s senior management, meets formally on a quarterly basis, to review credit reports and recommendations for PMA Ratings and deposit limits. PMA actively manages and adjusts bank’s ratings and deposit limits throughout the life of the deposit.
When deposits exceed FDIC or other federal deposit insurance limits, collateral must be put into place, which is monitored and reported to clients every month. Collateral programs offered by PMA include letters of credit issued by a Federal Home Loan Bank and marketable securities pledged to third party custodians.