Public Finance Market Update Trends
More Than a Rating
Graph 1, above left, measures the spread between a Aa2 non-Bank Qualified (NBQ) and a AA BQ bond issue in order to shed light on the benefit of BQ bonds, if any. The analysis shows that there is only a slight advantage to BQ bonds in the range of 0.04%-0.12%, depending on the term. Graph 2, above right, looks at the benefit of having an underlying AA-rating as opposed to an insured AA-rating (A underlying rating). While there was limited data, the data that was available indicated that the natural AA bond issue sold at levels 0.34% – 0.48% lower than its insured counterpart. Having a AA-rated insurance provider improves market access for lower-rated entities, but the comparison indicates that a natural AA underlying rating is far better received by the market.

Public Finance Market Update: Featured Market Data
Market Volatility Increased in March
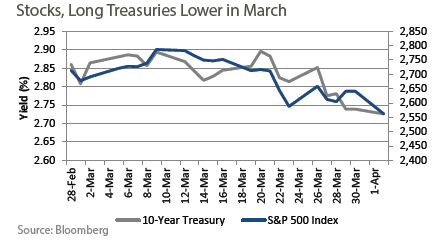
Trade-war fears, technology company weakness, White House turnover and action by the Federal Reserve all contributed to higher market volatility in March. For the month, the S&P 500 index was lower by over 5.5% and yields on the 10-year US Treasury bond were 13 basis points lower. The largest daily declines in yields on the 10-year Treasury were on March 1 (President Trump announced tariffs on steel and aluminum), March 22 (tariffs on Chinese imports announced), and March 27 (large-cap technology shares selloff). A somewhat more hawkish Fed also contributed to lower long-term Treasury yields and lower stock prices.
Source: Wall Street Journal
