Public Finance Market Update Trends
Credit Spread and Flat Yield Curve
Graph 1 (above left) measures the spread between a taxable bond issue and a nonbank
qualified tax-exempt one. Both were sold on the same day by the same AAA issuer in January 2018, providing reliable data points for this analysis. The minimum spread is 0.30% in 2032, and the maximum spread is 0.85% in 2022. This suggests significant opportunity cost for an issuer considering a taxable advance refunding in light of the recent tax reform policy that eliminates tax-exempt advance refundings. Interestingly, this penalty is more severe earlier on the yield curve. Graph 2 (above right) compares a AAA NBQ bond issue from January 2017 with a AAA NBQ issue from January 2018. Despite the recent rise in interest rates, this analysis shows that interest rates are still lower overall than they were a year ago.

Public Finance Market Update: Featured Market Data
Future Fed Hikes Being Priced Into Market
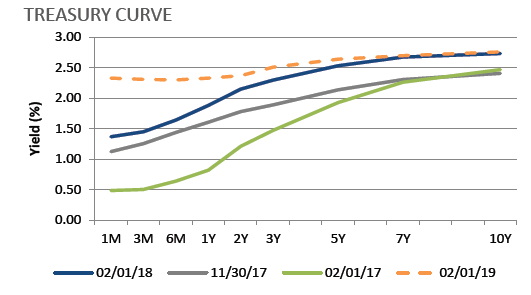
The Fed Funds Futures market has almost fully priced in three rate hikes by the Fed in 2018. The Treasury market is also pricing in future moves by the Federal Reserve as yields have increased considerably over the past two months. Treasuries with maturities between 2 years and 10 years have increased 30-40 basis points over this period. The dashed orange line in the chart below indicates where the market believes the Treasury yield curve will be on 2/1/2019 (Treasury futures). This Treasury futures yield curve indicates that 2-year to 10-year Treasuries will only increase by another 3-22 basis points over the next year.
Source: Bloomberg
