Public Finance Market Update Trends
Yield Curve Dynamics
Graph 1, above left, measures the spread between a NBQ AAA IL bond issue sold in January 2018 and a NBQ AAA IL bond issue sold in May 2018. These two bond issues reflect a significant change that has occurred in the bond market as short term yields have increased more than long term yields causing a flattening of the yield curve. In year three, the spread is 0.43% and in year 10, the spread is only 0.10%. In Graph 2, above right, we compare the 10-year Bloomberg Municipal rate with the 10-year US Treasury rate. The graph indicates that the ratio is currently around 83%, much lower than it was in the beginning of 2017 when it was upwards of 96%. This indicates that municipal bonds are rich compared to US Treasuries, so while interest rates overall are increasing, municipal bonds are still low on a relative basis compared to their US Treasury counterparts.

Public Finance Market Update: Featured Market Data
Steady Economic Growth
The US economy maintained a steady pace of growth during the first quarter.
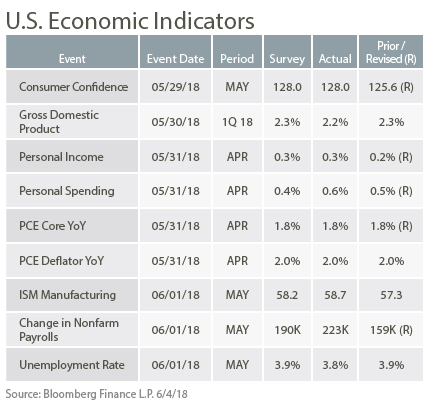
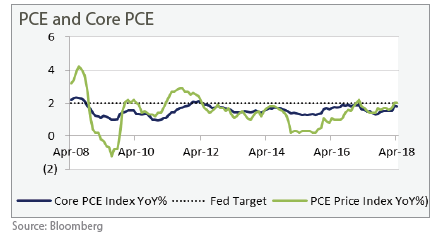
GDP rose at an annual rate of 2.2% driven by business investment and consumer spending. Improvements stemmed from income tax cuts and a strong labor market. Q1 2018 Consumer spending rose 1% following a robust 4% in Q4 2017. Inflation increased slightly with the PCE index up 2% in April while core PCE, excluding food and energy remained flat at 1.8%. Based on recent data, the market expects the Fed to increase interest rates in June. Our outlook calls for steady economic growth of around 2.5%. Risks include trade tensions and geopolitical concerns.
Source: Bloomberg, Wall Street Journal, Prudent Man Advisors, Inc.
