Public Finance Market Update Trends
Yield Spread Analysis
Graph 1, above left, measures the spread between a NBQ AAA IL bond issue and a BQ AAA IL bond issue. This comparison was made to analyze the benefit of BQ bonds. The analysis indicates that the BQ benefit in today’s Illinois market is still quite muted. The maximum spread is 0.10% and occurs in the 17-year term (2035).
There were even some points at which the NBQ bonds sold lower in yield than the BQ bonds due to other characteristics of the bond issue. Graph 2, above right, compares a NBQ Aa2 bond issue within IL with a NBQ AA bond issue outside of IL in order to quantify the IL penalty. Based on this comparison, the IL penalty ranges from 0.30% – 0.53% and is widest in the middle of the yield curve at the 9-year term (2037).

Public Finance Market Update: Featured Economic Indicator
U.S. Deficits Fueling Increased Debt Issuance
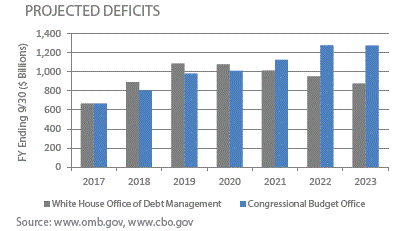
Additional tax revenue from rising GDP in 2018 has failed to offset tax cuts and higher spending, resulting in wider deficits. To finance the growing deficits, the Treasury is boosting sales of Treasury bills, notes and bonds. Many analysts and investors forecast that these developments will lead to higher borrowing costs for the U.S. government. The White House’s Office of Debt Management and the Congressional Budget Office (CBO) both anticipate growing deficits through 2019. The CBO forecasts a continued upper trend through at least 2028 while the White House predicts that growing GDP will reverse the trend beginning in 2020. However, few economists believe the economy will be able to attain the President’s goal of sustained 3% growth.
Source: BloombergWall Street Journal
