Credit Quarterly Recent News
U.S., China Escalate Trade War
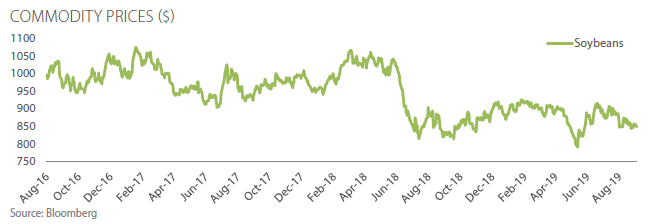
In August, President Trump announced a new 15% tariff on $300 billion of Chinese goods set to go into effect in September and December of 2019. The prospective tariffs would hit the majority of consumer goods imported from China, such as apparel, shoes, smartphones, laptops, toys, and video-games, which were spared in earlier rounds. Tariffs already in place on about $250 billion of Chinese imports, largely on items used by businesses, are set to rise to 30% from 25% in October 2019. In retaliation, China, which was one of the biggest export destinations for U.S. agricultural commodities from 2009 to 2017, said it would suspend all imports of U.S. agricultural products. According to the U.S. Department of Agriculture (USDA), China’s purchases of U.S. farm products in 2018 fell to $9.2 billion, down from $19.5 billion in 2017. Over the first six months of 2019, China’s agricultural imports from the U.S. were down 20% from the year-earlier period. Soybeans have been among the most affected as U.S. soybean sales to China in 2018 dropped 74% from the previous year to 8.2 metric tons and are down 24% year on year during Oct. 2018 – Jun. 2019. Trade tensions and years of low crop prices have caused agricultural credit conditions to weaken as non-performing assets in agricultural loans at U.S. banks increased to 1.64% in the second quarter of 2019, up from 1.54% the prior year. According to the FDIC’s 2019 Risk Review, “A slowdown in the agricultural economy is an important risk to the FDIC, because farm banks are a large source of financing for the agricultural industry and represent about one-fourth of banks in the United States.”

Credit Quarterly Banking Trends
2nd Quarter 2019 Highlights
FDIC-insured institutions reported second quarter 2019 net income of $62.6 billion, an increase of $2.5 billion (4.1%) compared with the prior year period. The improvement in net income was led by higher net interest income and an increase in realized securities gains. Almost 60% of all banks reported year-over-year increases in net income. Average net interest margin increased to 3.39% from 3.38% in second quarter 2018. Less than 4% of institutions were unprofitable during the quarter, unchanged from the year prior.
Provisions for loan losses in the second quarter totaled $12.8 billion, an increase of $1.1 billion from a year ago. More than one third of institutions reported higher loan-loss provisions than in second quarter 2018. Noncurrent balances for total loans and leases decreased $4.9 billion (4.8%) during the second quarter compared to the prior quarter. The average net charge-off rate increased two basis points from a year earlier to 0.50%.
Total assets rose by $177 billion (1.0%) from the previous quarter. Balances in all major loan categories experienced growth. Total equity capital increased by $38.6 billion from the previous quarter. Declared dividends in the second quarter totaled $48.6 billion, an increase of 29% from the same period last year. The number of institutions on the FDIC’s “Problem List” declined from 59 to 56 in the second quarter, the lowest number of problem banks since first quarter 2007. During the quarter, five new charters were added, 60 institutions were absorbed by mergers, and one institution failed.
Source: FDIC: Quarterly Banking Profile
Prudent Man Process
The Prudent Man Analysis
The Prudent Man Process includes four steps which begin with gathering data and analyzing a bank’s credit quality and continues with ongoing risk management throughout the life of a deposit. The process helps public funds investors avoid repayment, reinvestment and reputation risk that may be associated with a bank failure.
Step 2: Data Analysis – Quantitative
PMA conducts quantitative ratio analysis utilizing a proprietary model to analyze bank and holding company data. Ratios are compared to historical trends, bank peers, and performance benchmarks. PMA begins its quantitative analysis of a bank’s regulatory capital, asset quality and earnings by analyzing the following ratios:
1. Common Equity Tier 1 Capital
2. Nonperforming Assets
3. Return on Average Assets
4. Net Interest Margin
Additionally, PMA prepares a credit report for each bank that analyzes financial performance over a 5 year period. The analysis covers more than 50 ratios and delves further into a bank’s balance sheet, income statement and off-balance sheet exposure.