Public Finance Market Update Trends
Interest Rates and Bond Insurance
The graph above left compares Bloomberg AAA municipal rates from 7/9/19 with those from early May, the last edition of this newsletter. Interest rates continue to fall in 2019 with rates now lower by as much as 0.33% in just two months. The graph above right compares an underlying AA credit with an insured AA (A- underlying) credit. One may wonder if an underlying AA credit sells at better interest rates than an insured AA credit and, if so, why. If an insurance provider is rated AA and has pledged its capital to make debt service payments if missed by the issuer, should not the insured AA credit sell just as well as the underlying AA credit? The graph indicates that underlying AA credits do trade at better levels than insured AA credits, and at some points along the curve, at significantly better levels. In these two examples, the insured AA sold at rates approximately 0.20–0.30% higher than the underlying AA for most terms along the yield curve. While insurance undoubtedly improves a credit’s marketability, the data shows that investors still look to the underlying credit to determine the precise value of the security.

Public Finance Market Update: Featured Market Data
Stocks and Treasuries Diverge
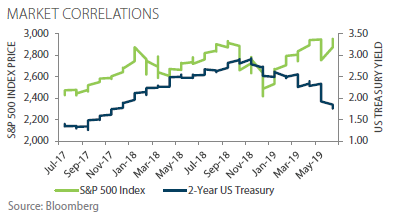
Stock and bond markets are expressing divergent views of the future. Typically, stock prices and bond yields rise together. Bond yields began to decline in the 4th quarter of 2018 and stocks declined as expected. However, stocks recovered in late December while bond yields have continued to fall. While the fixed income market may be ahead of the Fed, what’s more concerning is the impact, or lack thereof, the yield curve has had on equity valuations. Traditional correlations are broken, as risk markets have rallied right alongside their US Treasury risk free counterpart. Continued market volatility may be expected.
Source: Bloomberg, Prudent Man Advisors, LLC
