Recent News
U.S. Banks Report Strong Loan Growth
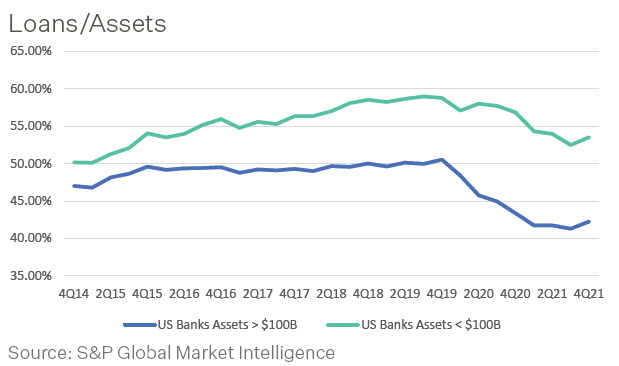
Loan growth in the U.S. banking sector picked up substantially in the fourth quarter of 2021, setting up what executives say is a promising outlook for further increases in 2022. Total loans and leases at U.S. banks were $11.2 trillion at December 31, 2021, representing a 3.0% quarter-over-quarter increase according to S&P Global Market Intelligence data. That equates to an annualized growth rate of approximately 12.4%, significantly higher than the 3.5% median quarterly annualized growth rate since the end of the Great Recession. Large banks (>$100B) drove much of the increase as loans were up 5.6% from the prior quarter. The period marked an emphatic end to six consecutive quarters of contraction or weak growth as lending was held back by pandemic-era forces including high levels of cash that have helped restrain consumer borrowing. The recent loan growth was distributed across several categories. Commercial and industrial loans, still well off their peak from mid-2020, increased 3.1%. Loans provided to nondepository financial institutions have more than doubled in the last four years and jumped 9.1% in the last quarter of 2021. Consumer borrowing also accelerated last quarter, with seasonally adjusted credit card balances growing 3.0%. The aggregate loan-to-asset ratio for U.S. banks was 45.91% in the fourth quarter, up 95 basis points from the prior quarter but still well below 53.21% in the fourth quarter of 2019.

Banking Trends
FDIC-insured institutions reported fourth quarter 2021 net income of $63.9 billion, an increase of $4.4 billion (7.4%) compared with the prior year period. The increase was primarily due to a $5.8 billion increase in net interest income and a $4.0 billion decline in provision expense. A majority (52.1%) of all banks reported year-over-year increases in quarterly net income. However, net income declined $5.6 billion (8.1%) from third quarter 2021, driven by a quarter-to-quarter increase in provision expense (up $4.5 billion to negative $742.4 million).
Quarterly provisions for credit losses have been negative for four consecutive quarters. More than half of all institutions (52%) reported lower provisions compared with the year-ago quarter. Noncurrent balances for total loans and leases decreased $3 billion (3.0%) from third quarter 2021. The average noncurrent rate was 0.89% during the fourth quarter, down five basis points from the prior quarter. The net charge-off rate declined by 21 basis points from a year ago to 0.21%.
Total assets rose by $467.7 billion (2%) from the previous quarter. Total loans and leases increased $326 billion (3.0%) from third quarter 2021, while securities rose $292.7 billion (4.9%). Total equity capital increased by $17.9 billion (0.8%) from the previous quarter. Banks distributed 64.8% of fourth quarter earnings as dividends, which were down $13.3 billion (24.3%) from third quarter 2021. The number of institutions on the FDIC’s “Problem List” declined by two from the third quarter to 44, the lowest level on record in the Quarterly Banking Profile (QBP). Total assets of problem banks increased to $170.1 billion from $50.6 billion the prior quarter. During the quarter, no new charters were added, 72 institutions were absorbed by mergers, and zero institutions failed.
Source: FDIC: Quarterly Banking Profile
The PMA Report
PMA Credit Research Process
The PMA Process includes four steps which begin with gathering data and analyzing a bank’s credit quality and continues with ongoing risk management throughout the life of a deposit. The process helps public funds investors avoid repayment, reinvestment and reputation risk that may be associated with a bank failure.
Step 2: Data Analysis – Quantitative
PMA conducts quantitative ratio analysis utilizing a proprietary model to analyze bank and holding company data. Ratios are compared to historical trends, bank peers, and performance benchmarks. PMA begins its quantitative analysis of a bank’s regulatory capital, asset quality and earnings by analyzing the following ratios:
1. Common Equity Tier 1 Capital
2. Nonperforming Assets
3. Return on Average Assets
4. Net Interest Margin