Credit Quarterly Recent News
Banks Face New Rules on Accounting for Credit Losses
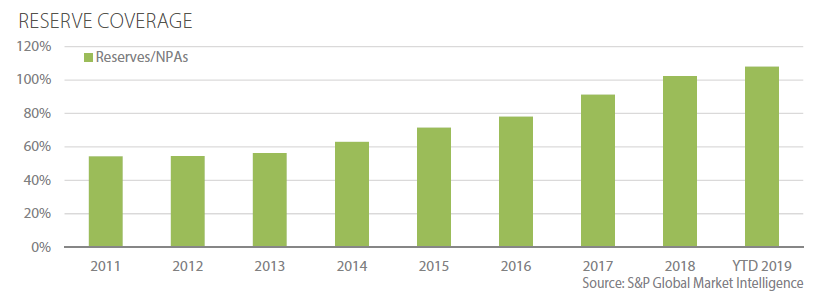
In July 2016, the Financial Accounting Standards Board (FASB) issued a new expected credit loss standard for banks and credit unions. The standard is eff ective for large, publicly traded banks in the fi scal year and interim periods beginning after December 15, 2019. FASB delayed the implementation deadline for small public lenders, private lenders, and nonprofi ts, such as credit unions, to December 15, 2022. The new accounting standard introduces the current expected credit losses methodology (CECL) for estimating allowances for credit losses, which will require institutions to reserve for estimated credit losses over the life of the loan at origination. Under the current incurred-loss model, banks are required to reserve for credit losses when losses are probable, and they usually reserve an amount suffi cient to cover losses over the next 12 months. During the fi nancial crisis, that method led to reserves for asset losses being too low relative to the quality of loans being extended and the probability that economic conditions could change. Inadequate reserves meant massive charges to earnings in a short period of time to refl ect the pending losses in loans. This left many banks with inadequate capital to sustain normal operations. The impact of the new rule is expected to be signifi cant with overall expected credit loss reserve levels anticipated to increase by as much as 35 percent to 50 percent by some estimates. In particular, the projected increases are being driven by consumer portfolios, which typically have longer lifetimes than commercial portfolios. In anticipation of the rule, U.S. banks have been increasing their reserves as loan loss reserves covered nonperforming assets 108% in the third quarter of 2019, up from 99% the prior year.

Credit Quarterly Banking Trends
3rd Quarter 2019 Highlights
FDIC-insured institutions reported third quarter 2019 net income of $57.4 billion, a decrease of $4.5 billion (7.3%) compared with the prior year period. The decline in net income was caused by nonrecurring events at three large institutions, which totaled $4.9 billion. These events resulted in higher noninterest expense and realized securities losses. Almost 62% of all banks reported year-over-year increases in net income. Average net interest margin declined to 3.35% from 3.45% in third quarter 2018. Less than 4% of institutions were unprofi table during the quarter, unchanged from the year prior.
Provisions for loan losses in the third quarter totaled $13.9 billion, an increase of $2 billion from a year ago. Less than 40 percent of institutions reported higher loan-loss provisions than in third quarter 2018. Noncurrent balances for total loans and leases decreased $185 million (0.2%) during the third quarter compared to the prior quarter. The average net charge-off rate increased six basis points from a year earlier to 0.51%, driven by increases in commercial and industrial and credit card loans.
Total assets rose by $213 billion (1.2%) from the previous quarter. Balances in all major loan categories experienced growth. Total equity capital increased by $3.5 billion from the previous quarter. Declared dividends in the third quarter totaled $47.8 billion, an increase of 9% from the same period last year. The number of institutions on the FDIC’s “Problem List” declined from 56 to 55 in the third quarter, the lowest number of problem banks since fi rst quarter 2007. During the quarter, four new charters were added, 46 institutions were absorbed by mergers, and zero institutions failed.
Source: FDIC: Quarterly Banking Profile
Prudent Man Process
The Prudent Man Analysis
The Prudent Man Process includes four steps which begin with gathering data and analyzing a bank’s credit quality and continues with ongoing risk management throughout the life of a deposit. The process helps public funds investors avoid repayment, reinvestment and reputation risk that may be associated with a bank failure.
Step 3: Assign PMA Rating and Deposit Limits
After all of the data has been gathered and analyzed, each bank is rated on a scale of 1 to 5 (with 1 being the highest and 5 being the lowest). Deposit limits such as day limits on the term for an individual deposit and aggregate dollar limits on deposits per bank are also applied.
The PMA rating reflects PMA’s opinion of a bank’s complete financial profile. The firm believes current financial performance alone often does not tell the entire story of a bank’s risk profile. Banks currently displaying strong performance may hold exceptionally high levels of risk. Conversely, some currently underperforming banks may hold acceptable levels of risk and represent a prudent investment for public funds. A thorough understanding of the banking industry and a detailed knowledge of each bank enable PMA to make informed judgments of the creditworthiness of each bank within PMA’s network.