Credit Quarterly Recent News
Margin Pressure
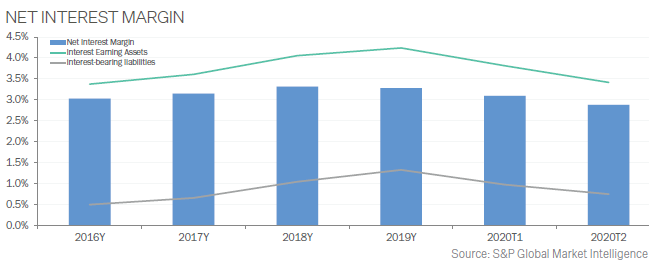
In the second quarter of 2020, net interest margin (NIM) plummeted across U.S. banks as institutions found little opportunity to put excess liquidity to work outside of low-yielding loans. Bank margins dropped 58 basis points as the industry’s NIM fell to 2.81%. Yields on total loans and leases dropped to 4.46% from 5.11% in the first quarter and 5.51% a year ago. The decline in commercial and industrial loan yields outpaced the broader loan group during the quarter. While loan yields dropped, in part due to the inflow of loans through the Payment Protection Program (PPP), NIM came under intensifying pressure as deposits flooded into the banking system. Deposit growth continued to accelerate, increasing 7.5% from the prior quarter and 20.8% from year-ago levels. Banks invested many of those deposits in low-yielding interest-bearing balances due—deposit at other banks—which rose nearly 22% from the prior quarter. Institutions also took the excess cash and put it to work in their securities portfolios, growing those positions 7.3% across the industry from the prior quarter. While the securities portfolio will typically offer higher yields than keeping funds at other banks, the sharp decline in long-term interest rates and support in the credit markets by the Fed, have kept yields lower than they have been in recent years. Most economists don’t expect interest rates to rise or Fed support to soften any time soon, meaning that banks are unlikely to find many new higher-yielding opportunities. The increase in deposits helped banks lower deposit rates pretty substantially in the second quarter. Banks’ cost of interest-bearing deposits dropped to 0.45% in the second quarter, down 40 basis points from the previous quarter and 57 basis points from a year ago. However, even with the substantial declines in deposit costs, earning-asset yields fell at a quicker pace, ultimately leading to NIM compression for banks.

Credit Quarterly Banking Trends
2nd Quarter 2020 Highlights
FDIC-insured institutions reported second quarter 2020 net income of $18.8 billion, a decrease of $43.7 billion (70%) compared with the prior year period. The annual decline is a reflection of continued uncertain economic activity, which resulted in an increase in provision expenses. Slightly less than half (47.5 %) of all banks reported year-over-year declines in net income, and the percentage of unprofitable banks in the first quarter increased from a year ago to 5.4%. Average net interest margin (NIM) was down 58 basis points from a year ago to 2.81%, as the decline in average earning asset yields outpaced the decline in average funding costs. This is the lowest NIM ever reported in the Quarterly Banking Profile (QBP).
Provisions for credit losses in the second quarter totaled $56.3 billion, an increase of $49.1 billion from a year ago. Almost two out every three banks (61.2%) reported year-over-year increases in loan-loss provisions. Noncurrent balances for total loans and leases increased $15.9 billion (15.50%) during the second quarter compared to the prior quarter. The average net charge-off rate increased seven basis points from a year earlier to 0.57%, driven by an increase in commercial and industrial loans.
Total assets rose by $884.6 billion (4.4%) from the previous quarter. Cash and balances due from depository institutions increased by $478 billion (19.9%) to $2.9 trillion. Securities holdings rose by $307.2 billion (7.3%), the largest quarterly dollar increase ever reported in the QBP. Total equity capital increased by $31.9 billion from the previous quarter. Quarterly net income in the second quarter totaled $18.8 billion, exceeding declared dividends of $14 billion, contributing $4.8 billion to retained earnings. The number of institutions on the FDIC’s “Problem List” declined from 54 to 52 in the second quarter. During the quarter, one new charter was added, 47 institutions were absorbed by mergers, and one institution failed.
Source: FDIC Quarterly Banking Profile
The PMA Credit Research Process
The PMA Process includes four steps which begin with gathering data and analyzing a bank’s credit quality and continues with ongoing risk management throughout the life of a deposit. The process helps public funds investors avoid repayment, reinvestment and reputation risk that may be associated with a bank failure.
Step 3: Assign PMA Rating and Deposit Limits
After all of the data has been gathered and analyzed, each bank is rated on a scale of 1 to 5 (with 1 being the highest and 5 being the lowest). Deposit limits such as day limits on the term for an individual deposit and aggregate dollar limits on deposits per bank are also applied.
The PMA rating reflects PMA’s opinion of a bank’s complete financial profile. The firm believes current financial performance alone often does not tell the entire story of a bank’s risk profile. Banks currently displaying strong performance may hold exceptionally high levels of risk. Conversely, some currently underperforming banks may hold acceptable levels of risk and represent a prudent investment for public funds. A thorough understanding of the banking industry and a detailed knowledge of each bank enable PMA to make informed judgments of the creditworthiness of each bank within PMA’s network.